Making a classification prediction with neural networks
Lee Hawthorn June 15, 2019 #R #AIIn this post I give an example of making a prediction with R stats for a type of business problem that requires a classification prediction.
The business question being answered is to evaluate the safety standard of cars based on certain parameters and classify them to predict Car Acceptability.
This data is obtained from UCI Machine learning repository.
There are many types of models that can be used for this such as Logistic Regression, Discriminant Analysis, Random Forests, and many others. You can spend a lifetime studying these.
We'll use an R package called Nnet to fit a single-hidden-layer neural network.
But before we do the modelling we need to load the data and process it to test/training sets.
 #Process data
car_eval <- read.csv("C:\\Users\\lee_h\\Documents\\R Stats\\Classification\\Data\\car.data.txt", header=FALSE)
colnames(car_eval)<-c("buying","maint","doors","persons","lug_boot","safety","class")
We're predicting the class which is a factor containing 4 categories.
Have a look at the data with the following commands
 head(car_eval)
summary(car_eval)
We'll train the model on 70% of random rows leaving the other 30% for testing.
 #Split to training/test
random_rows = sort(sample(nrow(car_eval), nrow(car_eval)*.7))
training_data <- car_eval[random_rows,]
test_data  <- car_eval[-random_rows,]
The model is built.
 # Neural Network
library(nnet)

# Build the model
model<-nnet(class~buying+maint+doors+persons+lug_boot+safety,data=training_data,size = 4,decay = 0.0001,maxit = 500)
The parameters used in the nnet() function can be tuned to improve performance.
- Size : Number of units in the hidden layer
- Decay : Weight decay specifies regularisation in the neural network. As a rule of thumb, the more training examples you have, the weaker this term should be. The more parameters you have the higher this term should be.
- Maxit : Maxium iterations, the default is 100. There's no way to determine the optimal iterations, it's a case of adjusting, running the model, checking performance. Try changing the iterations to 1000 and see the impact on accuracy.
summary(model)
You can check the residuals with
summary(model$residuals)
Once you're happy with the model you can run the prediction.
test_data$pred_nnet<-predict(model,test_data,type="class")
Evaluate the prediction.
 mtab<-table(test_data$pred_nnet,test_data$class)
confusionMatrix(mtab)


Confusion Matrix and Statistics


        acc good unacc vgood
  acc   111    0     9     0
  good    2   15     0     3
  unacc   1    0   364     0
  vgood   0    0     0    14

Overall Statistics

               Accuracy : 0.9711
                 95% CI : (0.9528, 0.9837)
    No Information Rate : 0.7187
    P-Value [Acc > NIR] : < 2.2e-16

                  Kappa : 0.9346

 Mcnemar's Test P-Value : NA

Statistics by Class:

                     Class: acc Class: good Class: unacc Class: vgood
Sensitivity              0.9737     1.00000       0.9759      0.82353
Specificity              0.9778     0.99008       0.9932      1.00000
Pos Pred Value           0.9250     0.75000       0.9973      1.00000
Neg Pred Value           0.9925     1.00000       0.9416      0.99406
Prevalence               0.2197     0.02890       0.7187      0.03276
Detection Rate           0.2139     0.02890       0.7013      0.02697
Detection Prevalence     0.2312     0.03854       0.7033      0.02697
Balanced Accuracy        0.9757     0.99504       0.9845      0.91176
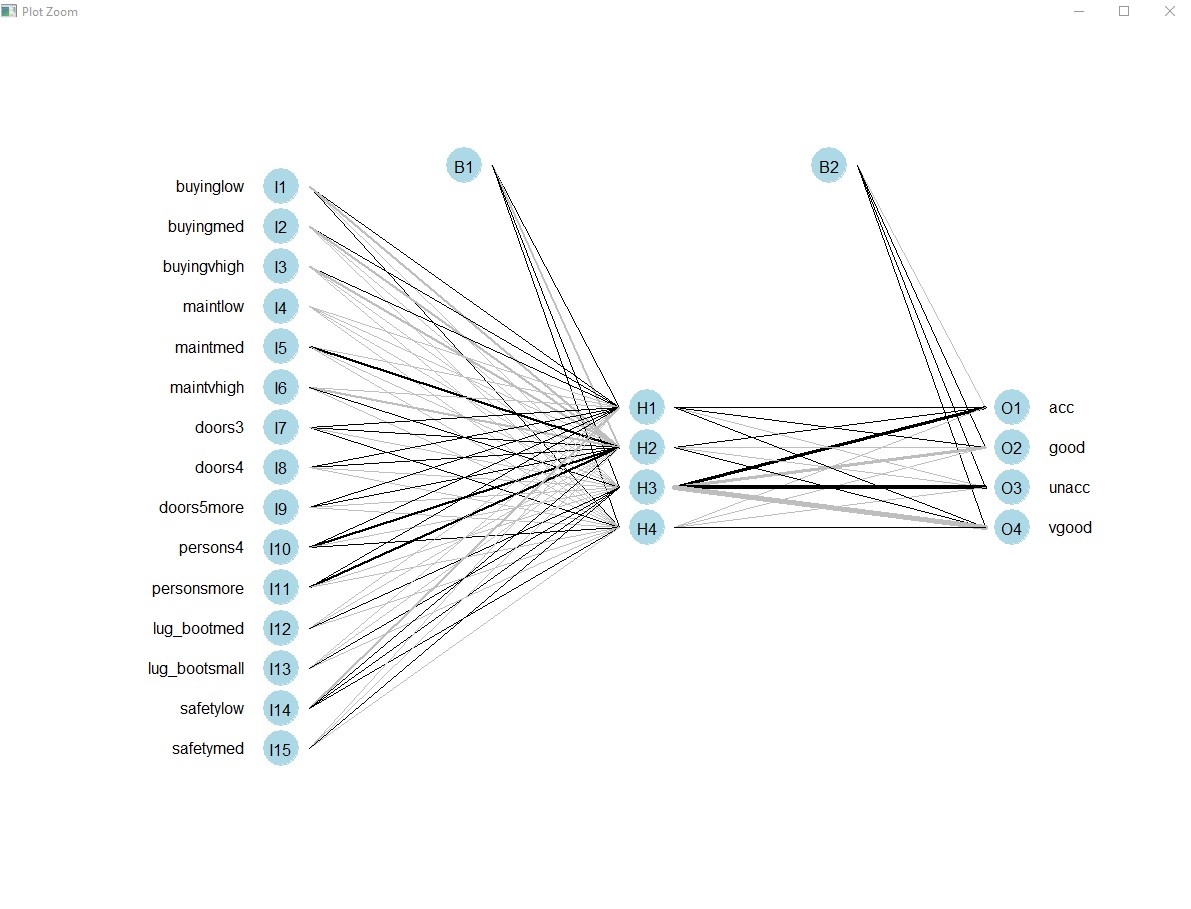
With Machine Learning models an important communication ability to being able to explain a model in terms of intuition. This can be tricky with Neural Networks as it's modelled after the brain !
I recommend the article here.
You can plot a Neural Network from nnet() to assist in this task. You need to install an extra function.
 library(devtools)
source_url('https://gist.githubusercontent.com/fawda123/7471137/raw/466c1474d0a505ff044412703516c34f1a4684a5/nnet_plot_update.r')

plot.nnet(model)
Summary
Neural Networks provide a powerful learning method to make predictions. On this data set I found Neural Networks beat Random Forests. You should always run different models to find the optimal results.
Be careful not to overfit. This is where the model that is run on the training data is fit so close that it is useless on the real data. We have the decay function to manage overfitting. Neural Networks are not so good at generalising across different business problems with different datasets. Always better to train on the actual data relevant to the question.
- Update : In 2018 I came across XGBoost which is usually used to train gradient-boosted decision trees and other gradient boosted models. My initial findings are that it uses less resources than Neural Networks and is somewhat easier to explain. I will run the XGBoost on this data when I get time.